2021 COVID Forecast Update: May
In this month’s COVID-19 update, I present the forecasts, compare previous forecasts to actuals, and provide my observations/commentary about where we are in the pandemic. There is also a sidebar comparing COVID-19 deaths as of this week to Flu and other leading causes of death in the US.
Forecast:
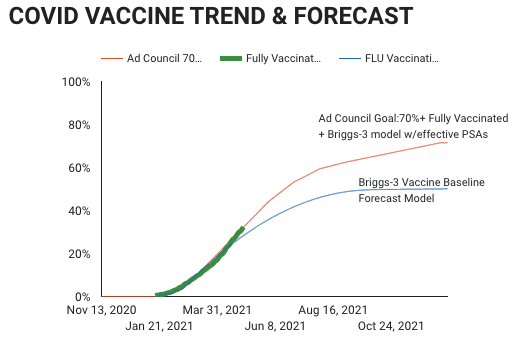
The one month forecast from the Briggs-3 model for the end of May, 2021 is for 595,687 COVID-19 deaths in the US. The Three Month forecast (from March 1) is for 582,709.
For comparison, the one month forecast from IHME projects a lower figure of 588,155 deaths at the end of the month. IHME’s Three Month Forecast is 573,847.
It is my view my Briggs-3 One-Month forecast is a bit higher than it should be because the Case Fatality Rate (CFR) in the model is based on a 21 day lagging average and CFR has been dropping quickly. The model expects the 21 day lagged CFR to fall from the 1.7% it has averaged since July 2020 to 0.9% by the end of May based on my analysis of Phase 3 clinical trial effectiveness combined with my model of the vaccination adoption rates by age. In other words, the higher vaccination adoption rate for 65+ changes the fatality rate overall.
Why keep a model that I believe will over-estimates deaths this month by a few thousand? Because this is a temporary transition in CFR. As CFR settles in around 0.9% based on the age distribution of who is and who isn’t vaccinated, the model should reliably predict the shorter-term and longer-term COVID-19 deaths.
Looking Forward:
The three month forecast (that is end of July), Briggs-3 model predicts 613,923 while IHME predicts 598,809. Some of the difference may be the declining CFR this month, but more of the difference is because the Briggs-3 model predicts a declining effectiveness of vaccinations as people relax social distancing and mask wearing. Specifically, I’ve analyzed breakthrough cases and deaths. A breakthrough case is when a person has been fully vaccinated for at least two weeks yet still contracts COVID-19). I’ve modeled how a reduction in mask wearing and social distancing would reduce vaccine efficacy from 95% to a range of 80 to 90%. In addition, my model for vaccination adoption assumes a significant slowing of vaccination adoption over the next three months, which will leave more people vulnerable to COVID-19 death.
While the forecast is a big improvement from the last three months, where 133,088 Americans died of COVID-19, the Briggs-3 model is predicting 37,586 will die of COVID-19, while IHME 22,427 deaths over the next three months.
My analysis suggests there is a seasonal component to COVID-19, similar to the flu. Seasonality should reduce the spread, viral load and fatality rate as we get into the summer months. Here is a chart trending COVID-19 deaths with a bad year of the Flu. Both seem to peak in December/January and decline as we move from winter to spring. The analysis I did last year based on latitude found seasonal difference in the cases and deaths. The Briggs-3 model doesn’t explicitly factor in seasonality. To the extent there is a strong seasonal decline, combined with expanding vaccinations, my hope is my three month out projection could be too high and that IMHE is the more accurate model.
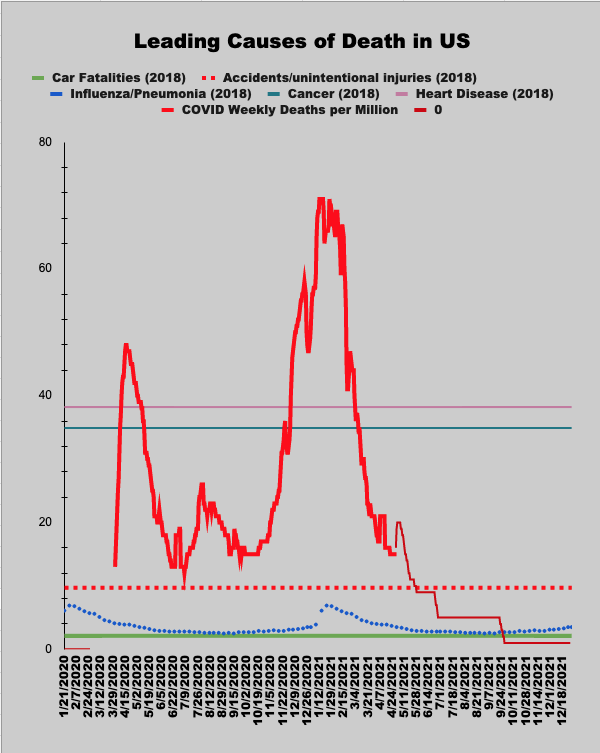
SIDEBAR: The chart shows the leading causes of Death in the US and is reported as deaths per million per week. Heart Disease, Cancer, Accidents (non vehicle) and Influenza/Pneumonia are typically the top 4 killers in the US. COVID-19 is currently #3 on the leading causes of death, with about 513,000 deaths in the past twelve months. The dotted blue line is the death per million per week for Flu and Flu related Pneumonia in 2018.
2018 was a particularly bad year of the Flu with 61,000 killed, according to the CDC (source: https://www.cdc.gov/flu/about/burden/past-seasons.html). In a typical year, about 35,000 people die of Flu/Pneumonia. Last year, during COVID, 22,000 died from Flu and Flu related Pneumonia.
In 2018, Flu related deaths peaked at 7 per million per week. COVID-19 peaked at 71 deaths per million per week. COVID-19 peaked at 10x worse than a the peak of a bad year of the Flu. As of the end of April, COVID is killing 15 per million per week, while a bad year of the Flu claims about 3 per million per week at the end of April - or about 5x worse than a bad year of the Flu.
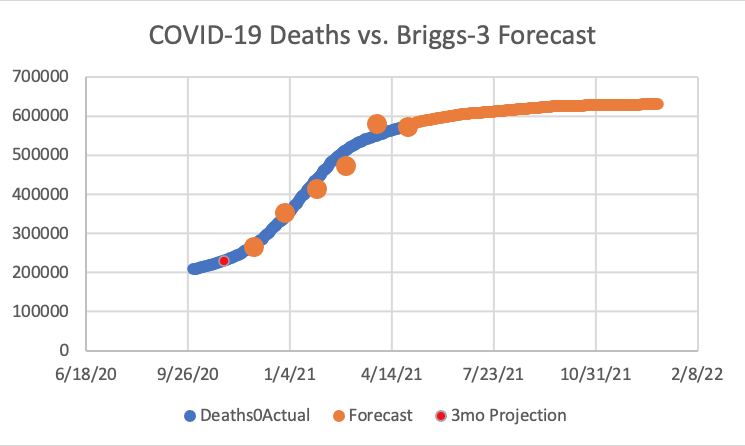
Full Year 2021 Projections
My 2021 COVID deaths projection was 601,000, and was made back when there were about 200,000 deaths. The current data projects we will land a little north of that forecast by the end of 2021. The dots represent the three month forecast from the Briggs-3 model, while the blue line represents the actuals from the NYTimes GitHub repository. The orange line is the forecast from the Briggs-3 model through the end of 2021. The model currently projects about 10% more incremental deaths than the original forecast, ending the year with about 630,000 total COVID-19 deaths.
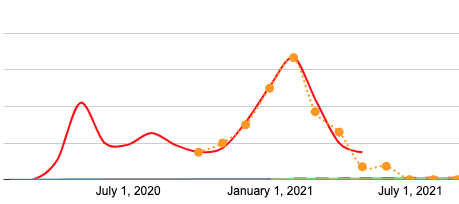
Another way to look at the data is the original projection of Deaths Per Million Per week at the end of each month. This chart shows the original forecast in a dashed line and actual in a solid red line.
You can see daily updates to my forecast with the second page in my dashboard (www.speakerrex.com/dash.html). You can see more details in the forecast section.
The two wild cards noted in my Jan 15th blog are: 1) whether the US wins the race against the virus and achieves 65% of better total population vaccinations before the fall and 2) whether variants escape vaccination protection and spread broadly.
Forecasting vs Actuals:
At the end of January, when there were 441,296 deaths in the US, the Briggs-3 model predicted April would end with 572,006. Actual is 575,635. This is a 2.7% difference.(IHME projected 593,651 - a 13.4% difference).
The one-month forecast, made on April 1, forecast 577,938, and was off by 9% (IHME was more accurate in the one month forecast, predicting 574,744, off by only 4%). Both projections can be considered “in range” of actuals.
Observations and Commentary:
The amount of active infections in the US should concern us all. Yes, COVID-19 deaths have come way down -- of the peak of 71 deaths per million per week to 15 per million per week -- just as predicted back in November. But, there are over 6.5 million active infections right now, according to Worldometers’s data summary:
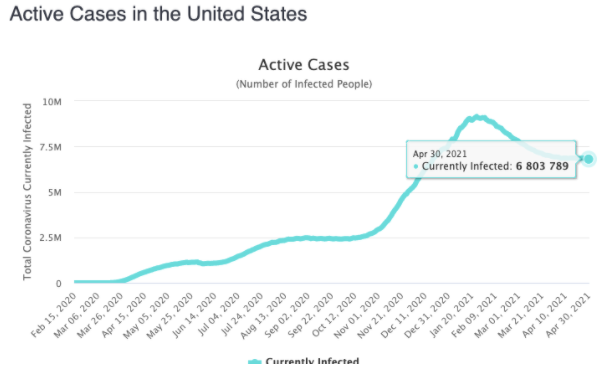
This is more active cases than the original model predicted for this point in the pandemic. To put this number in perspective, it works out to be about 1 out of every 50 people in the US is infected right now. If you are in a crowded restaurant or bar with 100 other people, odds are someone has the virus. Please read this CDC bulletin about how 46 people were infected from a bar event attended by 100 folks in rural Illinois.
To translate the risk, if someone in your household is infected with COVID, the odds of them spreading it to you are a little under 20% (about 1 in 5). If you are fully vaccinated, it lowers the risk to about 1 in 100. If you recently got one dose out of two, the odds are about 1 in 13 you will get infected from someone in your household if they are infected. Because this spread can occur when someone is asymptomatic or presymptomatic, it is tricky. If you are fully vaccinated + 2 weeks, your odds are better -- and if you’ve been infected and recovered, your odds are better -- but your risk is not zero.
Some activities are less risky. If you are outside, it is much safer. My very few restaurant occasions (after being fully vaccinated) have been outdoors. I’m signing up to play Bocce Ball outdoors at my club with my friends. These are much safer activities because they are outdoors and are not crowded.
You won’t find me singing in a choir. The attack rate in that setting -- or pretty much any setting where people are yelling, cheering, or singing indoors can be 60 to 80%. As the CDC Reported,in Washington State, one choir practice had about 4 out of 5 people contracting SARS-CoV-2. Even if fully vaccinated, the odds would still be about 1 in 20 of getting infected if someone in that choir has an active infection (whether they know they are infected or not).
I just completed an updated theatre room with stage lights, guitars, drum set and microphones. I have had a lot of fun over the years with family and friends as they unleash their inner rock star. But, the room will be quiet for a few more months. Why? Because it is up to us to end this. It is up to us to deprive the virus of the opportunity to spread and potentially mutate. We can be out of the pandemic by the start of July, and I want to make a contribution to that effort, even if it is as small as not having friends over for a music night just yet.
I do expect to dine indoors again soon and I am waiting to see active cases decline from about 1 in 50 people to about 1 in 350. That works out to be about 1 million active cases in the US or less. The way I think about it is that each interaction is a small fractional contribution to the spread. Mathematically, if a lot of us are cautious for another month, we can offset some of the folks that are not willing or able to deprive the virus of the ability to replicate. I am grateful that I am privileged enough to be fully vaccinated, work from home, have a good mask, and can be very selective about my in-person interactions. We will all pick our own threshold for when we relax our precautions -- for me, it is when the US has less than a million active cases based on my model. I am not saying my threshold is the right one for everyone. Hopefully, the data will help you weigh the risk and reward and consider your fractional contribution to ending the pandemic sooner rather than later.
While the pandemic isn’t over just yet. We are definitely headed in the right direction, and are on track for it to be over by Q3, but we have to get the rate of transmission (the RO) well below 1.0 this month and well below 0.5 next month. We need active cases to come way down. We can do this by getting vaccinated, and playing it safe until active infections drop.
For more information on the model, click on the dashboard and select Model Methodology at the bottom left.
Related Analysis
- 1 April, 2021:
April 2021 Update
- 3 March, 2021:
March 2021 Update
- 2 April 2020:
The Math Of Why Herd Immunity Isn't Viable in 2020