2021 COVID Forecast Update
Will The COVID Pandemic Be Over In Q3?
This post is dedicated to David Berkowitz, a fellow Research Wonk, who wrote:
- “I love this forecast. Fascinating, Rex. How quickly are you adapting your forecast with Biden's promise that we'll have supply for all US adults by the end of May? I'd imagine even that is him being safe; this administration is very big on underpromising and overdelivering when it comes to these timelines.”
Great question David.
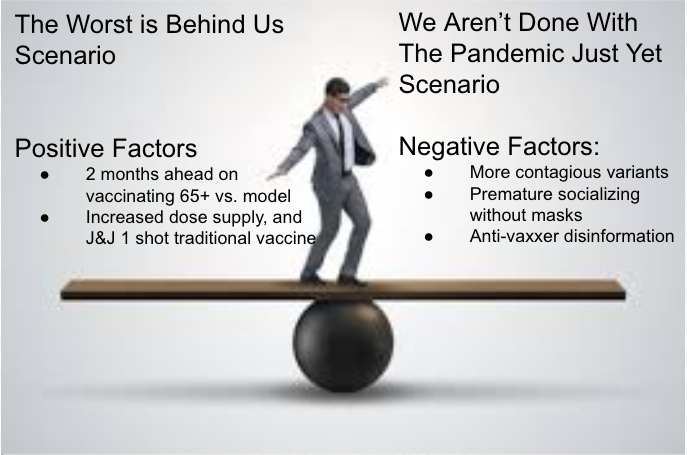
The US is once again at a breakpoint. I’d like to believe we are breaking good, but I’ve pointed out two other major breakpoints in the pandemic, and we broke bad each time - so recognize many have a bias toward the positive news. We all want this to be over and are looking for silver linings. Let me break down what is in the balance:
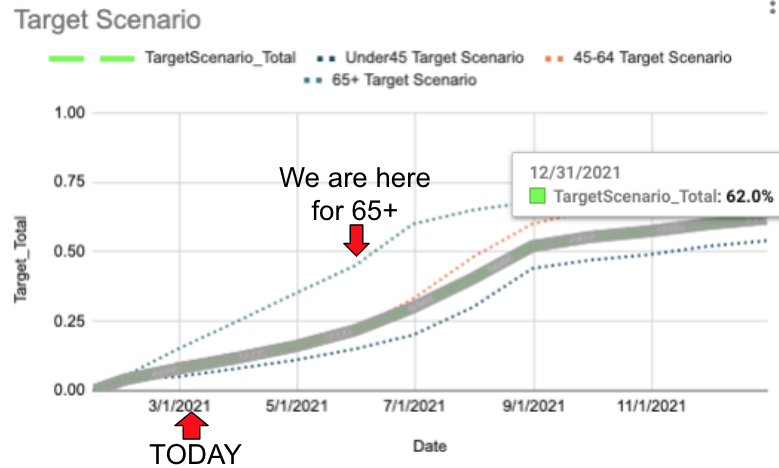
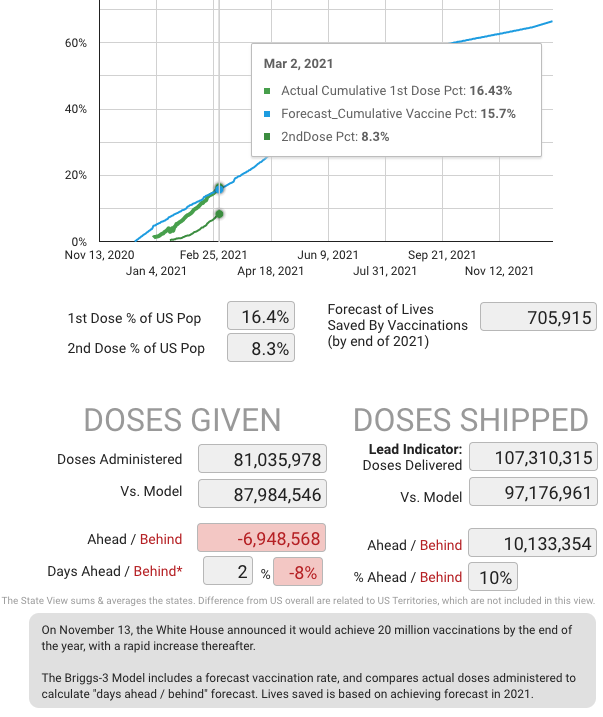
The strongest argument that the worst is behind us is the White House reporting that nearly 50% of 65+ have already been vaccinated. I have not been able to independently verify this as the CDC data on vaccination by age is stale -- from Mid January! Assuming WH is correct, take a look at where that puts us vs. my November model that called for an end to the pandemic in early Q3.
As a recap of the chart and quote from the November report:
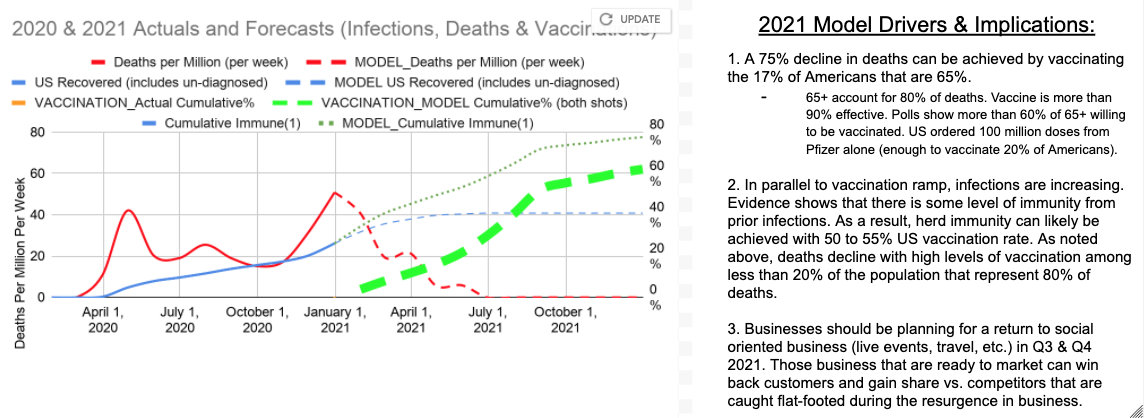
"The forecast chart shows solid lines for actual and dashed for forecast. The red line shows the lives lost per million per week due to COVID-19. The blue line shows the COVID-19 percent of the US that has recovered, including those undiagnosed, in the US. This blue line also represents the cumulative immune due to recoveries from infection. The ability to estimate total infection rate (including undiagnosed) is based on my model, which will be discussed in this paper. The dashed blue line is the forecast recoveries from infection, which flattens out as increased vaccinations reduces the spread of the virus. The dashed heavy green line is a forecast of completed vaccinations…
The base case forecast for 2021 uses a 62% vaccination rate by the end of the year, with 75% among 65+ and a zero among children under 10. The vaccine is currently authorized for people 16 and older - which leaves out about 20% of the total US population. We may see an expansion of vaccinations for children 10 and older toward the second half of 2021 - which would expand the eligible US population to 88%, but that expansion is uncertain. The model calculates the Lives Saved only among those vaccinated. Lives Saved is also referred to as "Deaths Averted" and is calculated based on the infection fatality rate (0.4%) times the attack rate (85%) times the vaccine efficacy rate (95%). The number of lives saved due to the Vaccine is currently forecast in my model to be 706,979."
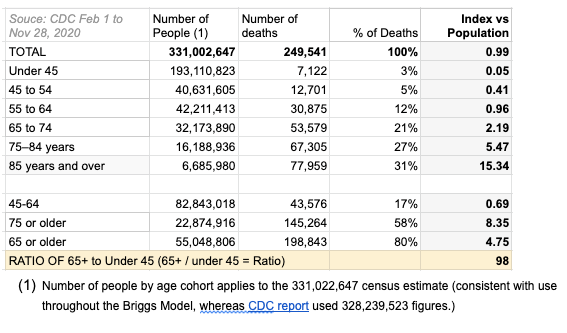
“The age distribution of who gets vaccinated matters… The reason for this significant difference is the fatality rate based on age. I first observed these differences in February 2020, when I analyzed the first 50 deaths in Hubei. The pattern was the same when China's CDC published the death statistics by age on the first 1,000 deaths and it is similar to the pattern in the US when the CDC published data on the first 250,000 deaths. That is, people 65+ are about 100 times more likely to die of COVID compared to those under 45 years of age.
Looking at that 65+ vaccination rate, if we can get to 85% of 65+, we can avert more than 750,000 deaths thanks to the vaccine. If we are already around 50%, we are a full two month ahead of forecast, and well on our way to ending the death toll from the pandemic.
In addition, because January and February were a bit worse than forecast back in November, we actually have more people in the population that have some level of natural immunity. To quote from the original model whitepaper, “To calculate progress toward herd immunity, the model applies a random duplication of vaccinations to those already infected. For example, if 30% have already been infected (meaning that 70% are not immune), and vaccination rates hit 50%, then the net immune will be 65% (by the random duplication logic, half of the 30% already infected will also be vaccinated).”
Another positive element of good news is the Case Fatality Rate (CFR) is improving. It had been at 1.7% of those with a positive test result dying on average about 21 days later, and that figure is now about 1.5%.
With J&J one shot offering another option for people, and a lot more doses in the distribution pipeline, there are lots of reasons to be optimistic.
However, check out the last two months of 90 day forecasts from IHME and from my own model. My forecasts were within range, but IHME underestimated by so much that they weren’t even with range. I under-estimated deaths and the actual was just barely within range the upper end of my range.
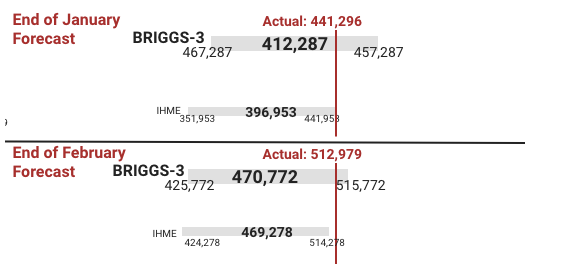
I’d submit to you that we should be aware that we’ve recently been under-estimating COVID. Our short term (4 week) forecasts are pretty similar.
Deaths at end of March:
- Briggs 3.0 (Model assumptions set Nov2020): 547,006
- Briggs 3.1 (Model assumptions updated Jan 15th): 556,670
- IHME: 545,136
- IHME Worst Case: 545,749
- COVID Forecast Hub: 555,356 at end of the month (they quote 550,400 deaths by March 27 as they only forecast 4 weeks out, so I extended their daily average of 1,239 per day by 4 days).
The big question is where we will be in three months from now. IHME projects 573,847 at the end of May. Their worst case is 600,133. On the other hand, Briggs-3 projects 582,709 and Briggs-3.1 (worst case) projects 676,670. That's a meaningful difference in my model. What causes such a big difference in deaths?
The answer is a relatively small difference in the growth in cases. The longer-term model (that is more than three weeks out) uses a "Growth in cumulative cases" percent of 1.5% for the rest of March, and 1% for April and May, followed by 0.5% for June through August. We are at 1.6% weekly growth in cases over the cumulative case count for the past week. If that rate increases to 3%, we end up in a far worse place. Keep in mind it was 6.7% in January and averaged 2.7% in February. We've got to keep this rate low for another month to allow enough time for second vaccine doses to be administered (plus another week for them to be fully effective).
I think some states are taking a dangerous gamble removing masks this month instead of next month. I plan to remove my worst case once I can confirm 65+ have indeed exceeded 50% FULL (2 dose) vaccination rate. But, I worry the 50% figure is counting first dose, which helps but not as much as full vaccination. I am also keeping an eye on the states removing mask mandates. It seems premature by about a month. But, with the accelerated vaccinations of 65+, it might be OK.
To answer the question David posed directly, I have a running blog of factors that might lead me to change the model assumptions. This includes distribution. As of today, the US is 8% behind on doses distributed and 10% ahead on distribution compared to my model. The Biden administration is tracking at nearly 3 million doses distributed per day over the past 7 days, and an average of nearly 2 million vaccinations per day. That is great! But, that is not enough to warrant a change to the underlying model assumptions made in the Briggs-3 model back in November. If you want to see a daily tracker, check out the dashboard and click on vaccinations on the left. The “next” page will move you to the Biden 100 day vaccination tracker.
In sum, there are some things to keep and eye on, but it seems like we are getting a good break this time.
For more information on the model, click on the dashboard and select Model Methodology at the bottom left.
Related Analysis
- November 2020:
How The Vaccine Can End The Pandemic By Q3 2021
- 28 April 2020:
Guns, Germs And Beer. Four Phases of the Economy
- 2 April 2020:
The Math Of Why Herd Immunity Isn't Viable in 2020